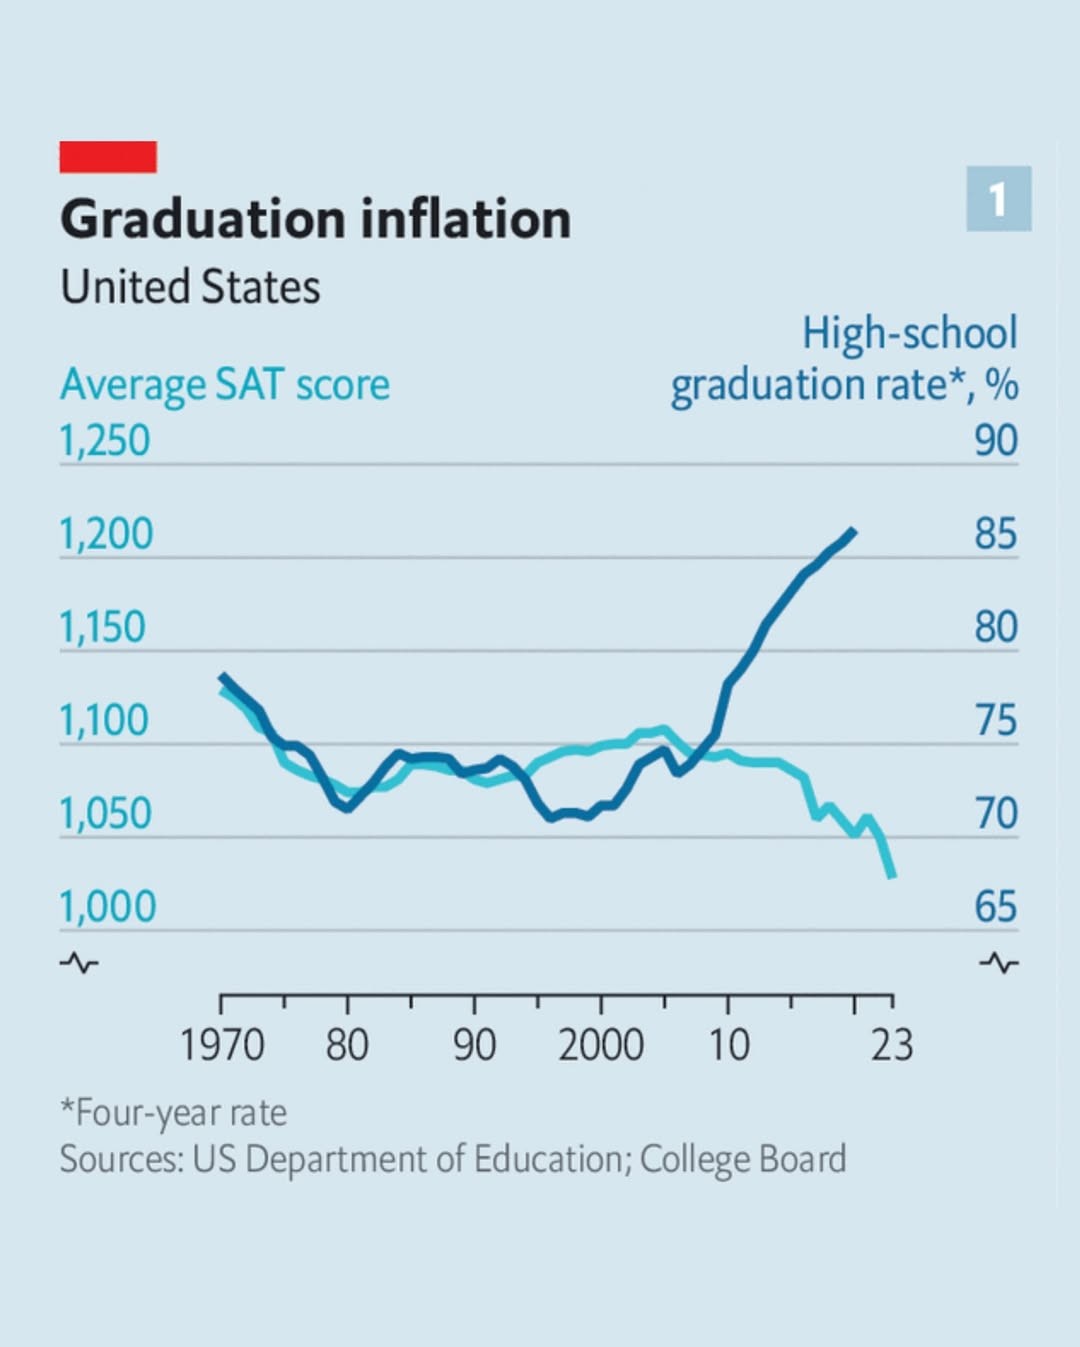
This graph makes the SAT drop look worse than it is and speaks to the demographic on Lemmy, smart people who see a drop in broader test scores as a broader drop in intelligence. This isn’t what is being shown. It’s showing how when the high school dropouts are included the scores drop 150 points so we need to improve the part of education that serves the people who were excluding themselves from graduation.
This graph makes the SAT drop look worse than it is
Yes, an example of why dual y-axis plots are problematic (when the variables are not direct mathematical transformations of each other).
And notably, many changes have been introduced to the SAT and SAT scoring over that time. It’s unclear to me from the information here how those have been accounted for in the data.
I think it’s mostly an illustration of the issue with the “No Child Left Behind” initiative.
Teachers are forced to pass students that should rightfully fail, so the students who normally would be held back or forced to retake a class are taking the test before they’re ready.
It’s still a bad thing unless people decide to make college free for all people, and at least in the US, the country can’t even afford universal health care.
If someone is taking the SAT and getting 1000, they are so much better off going to a trade school and becoming an air condition repair person or learning home repair. Many of those people with 1000 will not graduate college, will not graduate with substantial debt, and will be trying to get office jobs in a country that already has too many people wanting that and not enough skilled people doing physical work.
It’s not what people want to hear, but everyone has strengths and weaknesses. Some people are terrible at intellectual things, some people are terrible at things requiring dexterity, some people are terrible with things requiring emotional intelligence.
Another “forbidden topic” that I’ll likely get in trouble for (for no reason) is that people who have children at older ages are more likely to have less healthy or even disabled children. There are costs to society of “let’s try to have everyone stay in school and delay marriage and children until people’s 30s.”
Yes, we need to reduce income inequality and food insecurity and make sure everyone has wages that are livable, but the whole everyone gets a trophy thing is bad resource management. Yes, food insecurity and wealth is part of the issue, but everyone has access to a library. 1000 is so low, it’s barely doing better than random guessing. Teachers are very happy to help out kids who don’t understand things; they often can’t motivate students to do anything on their own these days.
If a kid is getting a 1000 on the SATs, there’s either no ability or no motivation or some combo, and college will not change that. Advanced schooling should not be encouraged by society for people who can’t even understand a tiny amount of the basics.
This graph is actually encouraging and I suspect anyone who cannot process why doesn’t have high sat scores.
More people are graduating. People who drop out don’t take the sat. Since the sat drops at a slower rate then the graduation rate increases, those previous drop outs are on average better at the sat.
I generally agree that the graph doesn’t imply anything bad, but without knowing the distribution of test scores, we can’t conclude that average sat performance actually improved. With a general sat score statistic we could attempt to predict how an X% increase in presumed low performers looks like, and then compare that to reality.
The graph indicates the average test score dropped. I’m looking at what can be inferred from this limited data and how it could be structured to reveal a person’s ability to apply critical thinking.
The graph alone isn’t enough, it would need some blurb with the details you’re mentioning and more to make the choices unambiguous.
It’s showing how when the high school dropouts are included the scores drop 150 points
What is your basis for this claim? I don’t doubt that’s a possibility, but the number of students taking the test both rose and fell over the past decade, with a fairly consistent drop in scores
I think it was 2006 or 07 when they introduced the writing portion of the SAT, which students were broadly unprepared for. I was one of the first go-around. It was… weird?


This graph makes the SAT drop look worse than it is and speaks to the demographic on Lemmy, smart people who see a drop in broader test scores as a broader drop in intelligence. This isn’t what is being shown. It’s showing how when the high school dropouts are included the scores drop 150 points so we need to improve the part of education that serves the people who were excluding themselves from graduation.
We can address the primary factors of drop out/low scores by solving wealth inequality and food insecurity.
Yes, an example of why dual y-axis plots are problematic (when the variables are not direct mathematical transformations of each other).
And notably, many changes have been introduced to the SAT and SAT scoring over that time. It’s unclear to me from the information here how those have been accounted for in the data.
I think it’s mostly an illustration of the issue with the “No Child Left Behind” initiative.
Teachers are forced to pass students that should rightfully fail, so the students who normally would be held back or forced to retake a class are taking the test before they’re ready.
It’s still a bad thing unless people decide to make college free for all people, and at least in the US, the country can’t even afford universal health care.
If someone is taking the SAT and getting 1000, they are so much better off going to a trade school and becoming an air condition repair person or learning home repair. Many of those people with 1000 will not graduate college, will not graduate with substantial debt, and will be trying to get office jobs in a country that already has too many people wanting that and not enough skilled people doing physical work.
It’s not what people want to hear, but everyone has strengths and weaknesses. Some people are terrible at intellectual things, some people are terrible at things requiring dexterity, some people are terrible with things requiring emotional intelligence.
Another “forbidden topic” that I’ll likely get in trouble for (for no reason) is that people who have children at older ages are more likely to have less healthy or even disabled children. There are costs to society of “let’s try to have everyone stay in school and delay marriage and children until people’s 30s.”
Yes, we need to reduce income inequality and food insecurity and make sure everyone has wages that are livable, but the whole everyone gets a trophy thing is bad resource management. Yes, food insecurity and wealth is part of the issue, but everyone has access to a library. 1000 is so low, it’s barely doing better than random guessing. Teachers are very happy to help out kids who don’t understand things; they often can’t motivate students to do anything on their own these days.
If a kid is getting a 1000 on the SATs, there’s either no ability or no motivation or some combo, and college will not change that. Advanced schooling should not be encouraged by society for people who can’t even understand a tiny amount of the basics.
This graph is actually encouraging and I suspect anyone who cannot process why doesn’t have high sat scores.
More people are graduating. People who drop out don’t take the sat. Since the sat drops at a slower rate then the graduation rate increases, those previous drop outs are on average better at the sat.
Analysis of this graph could be an sat question.
I generally agree that the graph doesn’t imply anything bad, but without knowing the distribution of test scores, we can’t conclude that average sat performance actually improved. With a general sat score statistic we could attempt to predict how an X% increase in presumed low performers looks like, and then compare that to reality.
The graph indicates the average test score dropped. I’m looking at what can be inferred from this limited data and how it could be structured to reveal a person’s ability to apply critical thinking.
The graph alone isn’t enough, it would need some blurb with the details you’re mentioning and more to make the choices unambiguous.
The number of students taking the SAT peaked in 2019
What is your basis for this claim? I don’t doubt that’s a possibility, but the number of students taking the test both rose and fell over the past decade, with a fairly consistent drop in scores
I think it was 2006 or 07 when they introduced the writing portion of the SAT, which students were broadly unprepared for. I was one of the first go-around. It was… weird?
deleted by creator
Seriously? The link is right there. And where the fuck are you getting rhubarb in January? It’s a fall veg. Fuck off.