
It turns out that road design has significantly more impact on speeds and safety than posting cops everywhere. Who’d of thought that?
… Except everyone who does actual research on the topic, of course.
Less totalitarian than posting cops everywhere, too.
What did they do to reduce speeding? Speed cameras? Bumps?
Higher speed limit?
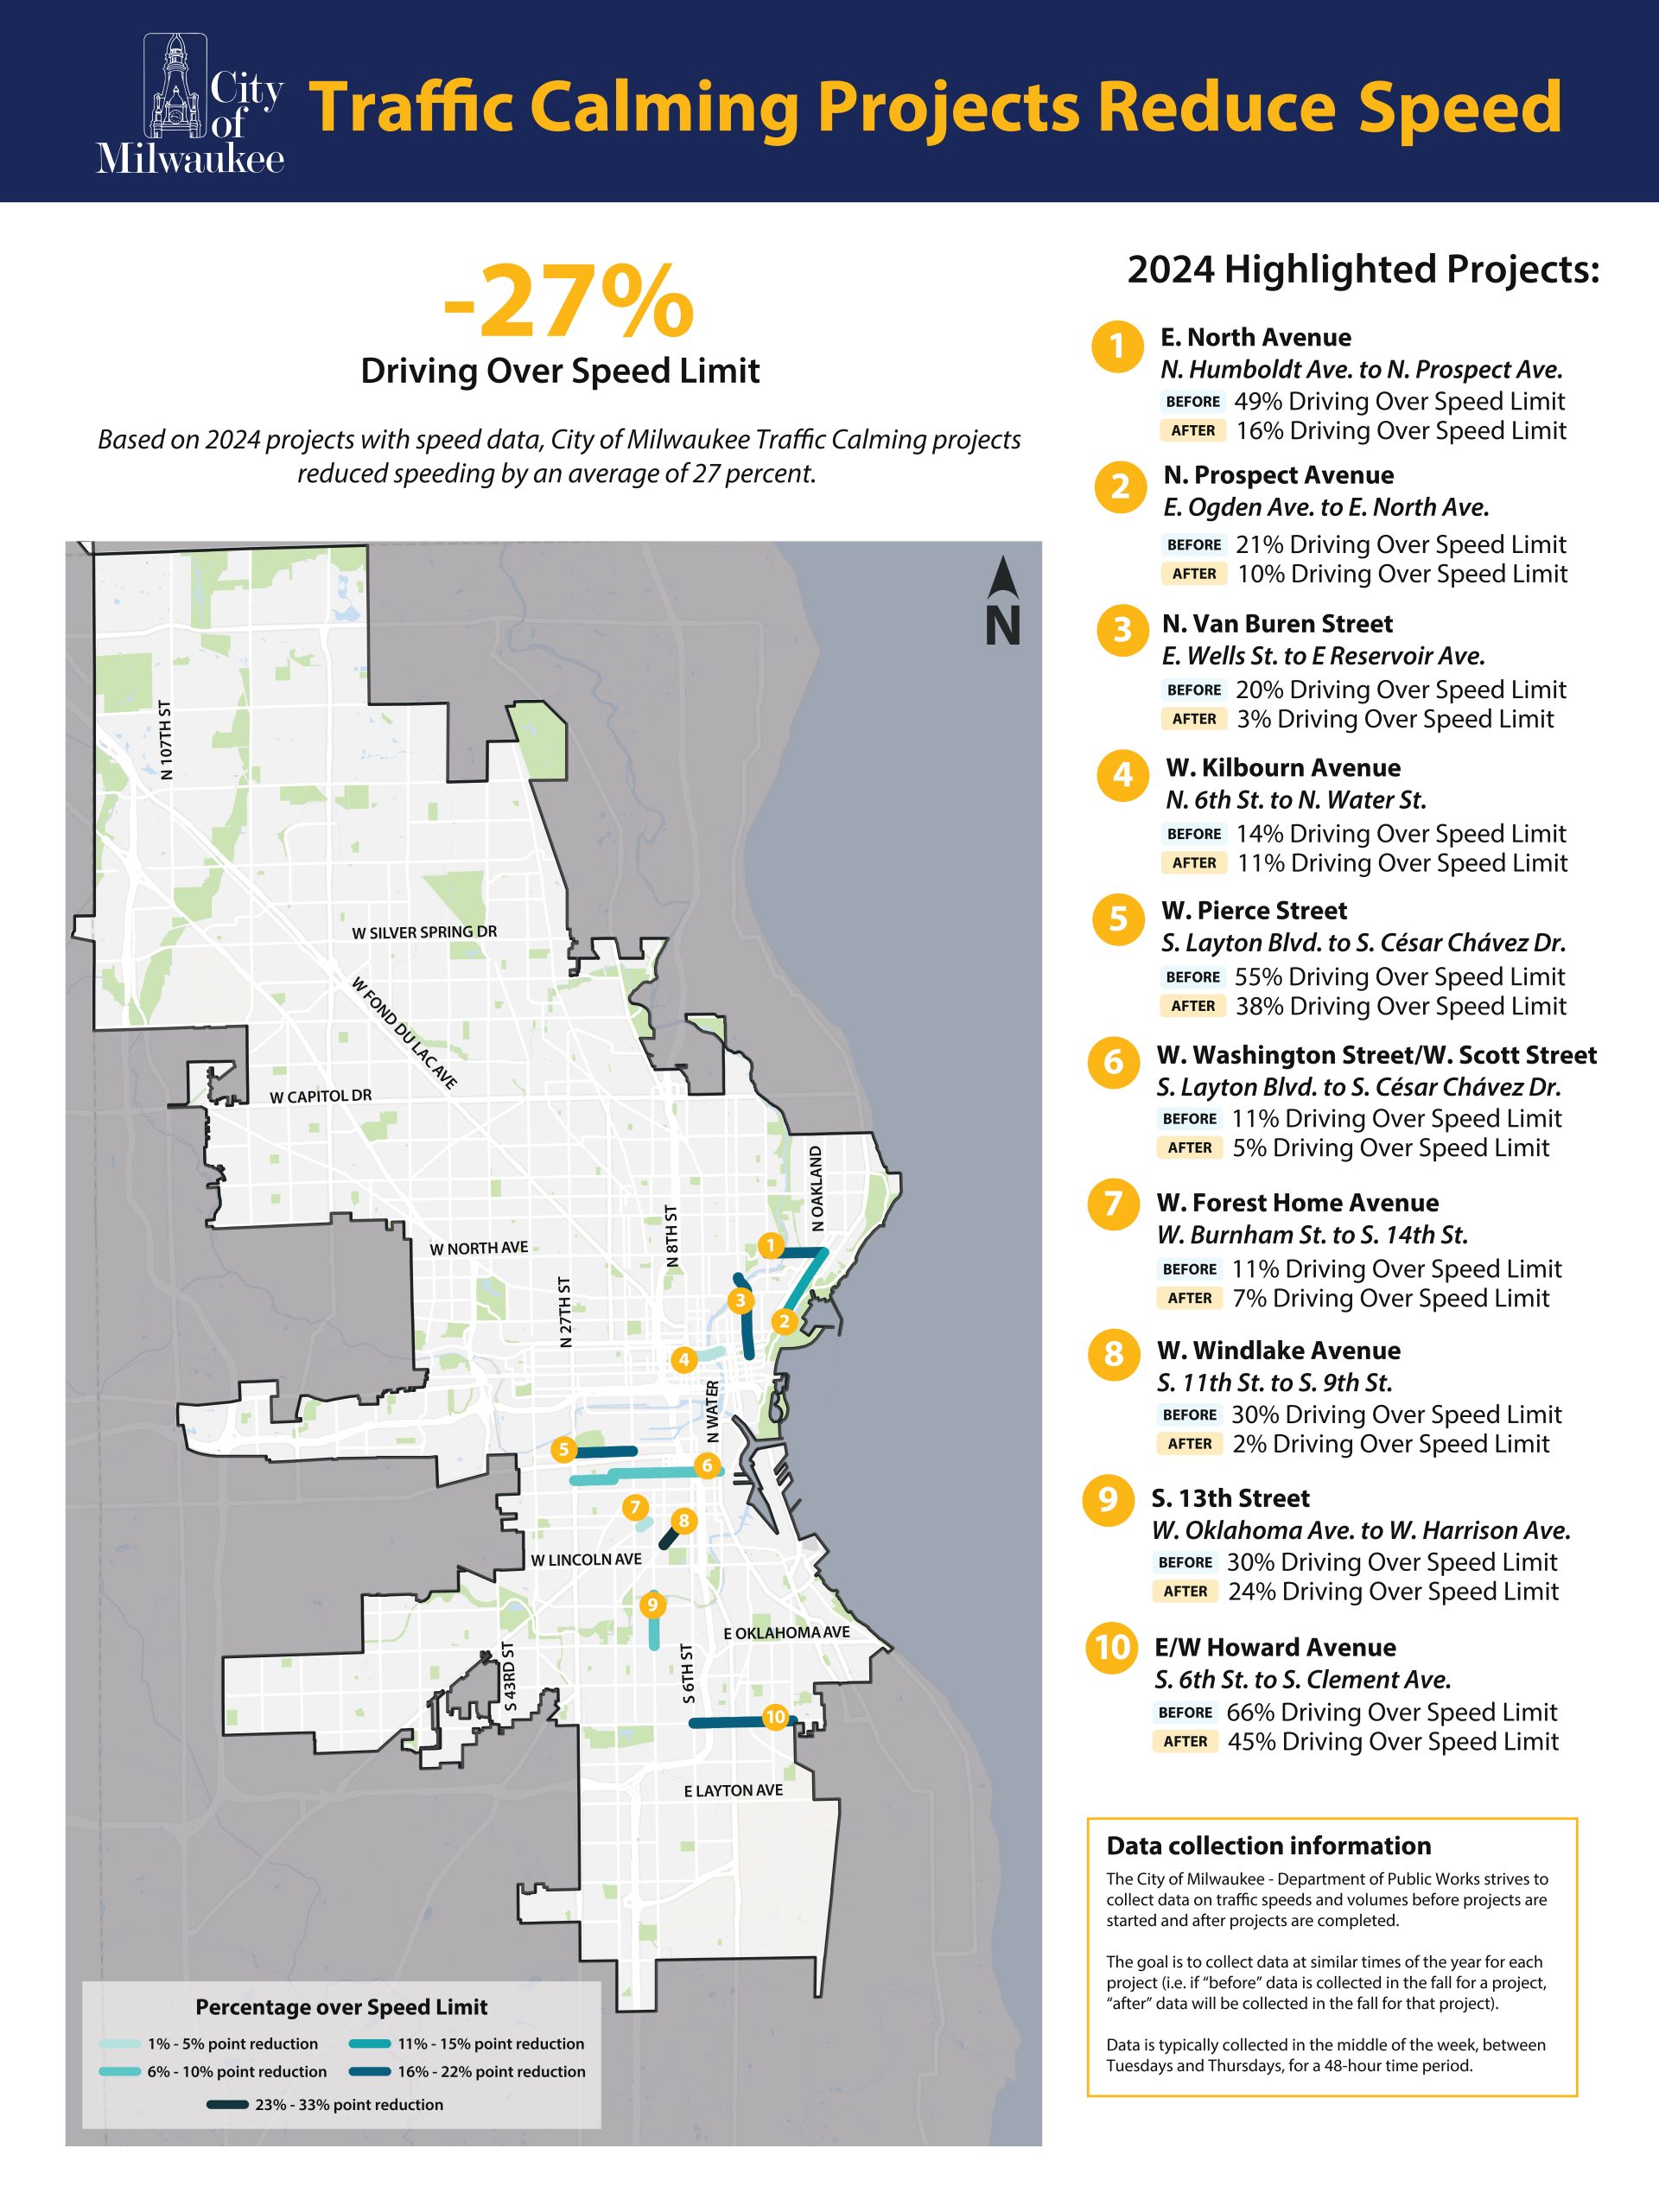
Based on a pdf I found here, they used speed humps, speed tables (speed humps but longer), traffic circles, curb extensions, chicanes, neck-downs (a curb extension in the middle of a block as opposed to next to an intersection), and pedestrian islands.
Higher speed limit?
🤣 took me a few seconds, but made me smile
The LED sings that show your speed are really good at keeping you from speeding by distracting your attention to the possibility of getting a ticket or being stopped by a cop and sent to Bolivia. Oh pedestrians? Yeah those people!
Same for the stupid morning cop near the education centers… I’m not looking for kids who might jump into the road. I’m looking for cops who might give me a ticket. And it doesn’t help that you gotta go at 20mph in that zone which is below some Toyota magical hybrid threshold that kills my battery if I keep going that speed for a few meters.
Yeah I think it would be best to have GPS controlled speeds on every car. That way you could do your driving as safe as possible and cops could go find someone else to murder. In the suburbs near Seattle you can’t not have a car. We don’t have a good public transport infrastructure yet. But we’re getting there soon. Like I already have a bus lane within 3 blocks of my home…still a terrible idea during winter. A person could die waiting for a bus on winter. Also on winter not all cars can actually drive on ice and similarly a bad idea for bicycles. But that’s a different story.
4, 6, and 7 didn’t have significant speeding rates to begin with. Did they (or any other sections) also have reduced speed limits? 5, 9, and 10 still ended with decently high speeding rates. Do they have plans to further address them?
How did they measure this data? I guarantee you that sentence is false because it’s impossible to measure such a thing.
Impossible? All it takes is two rubber tubes across a street at a fixed distance apart and a little box on one end to calculate the speed based on the time between wheels passing over them. Done all the damn time in the UK.
And they don’t claim to measure it at every single location across the city. They claim to have measured it at ten locations. That takes, at most, twenty installations.
ThisThis sentence in the post title doesn’t specify that [the ten locations]
How do you figure?
Dude with a radar gun or two coils under the pavement.
At every single location in the city?
At the 10 locations posted in the OP. Data is collected at the same time each year, and over a 48-hour period.
It’s very easy to do, and since the number of vehicles recorded is often in the thousands, the trends would be very easy to see.
That sort of data actually is available these days, from brokers like Inrix that collect it from cellphone signals and traffic cameras and such.
Departments of Transportation trying to measure the impact of a specific project are still more likely to do it the semi-old-fashioned way, with traffic studies before and after, though.
You should try this next time you get pulled over for speeding.
“But officer, how can you know I was speeding? It is impossible to measure such a thing!”
It’s impossible to measure every single instance speeding. Just like it’s impossible to measure crimes committed, just convictions or reports.
You don’t need to know every single instance of speeding. You just a good representative sample, and then you can plot your trendline from that. That is how statistics like that are measured.
You can’t measure actual crimes committed. However, you can make a reasonable guess by factoring in your known unknowns. For example, assume we have a significant sample of reported crimes in a city. Let’s pull the number 50/100k people out of our rear end for example purposes.
As you pointed out, we only have the data from the reports. The total number is known unknown. We could then look at a different data set, like a survey, that says something like 20% of people who are victims of the crime never report it, or 20% of people admit to doing it and not getting caught, whatever the case may be.
So, we can cross reference those two statistics to estimate that the “real” rate of that crime is closer to 60/100k people. Even though neither study can predict that number individually.
“Real” crime rates are ridiculously high. Something like 2 per person per day.
Ok, let the numbers be for some specific crime then. I’m just walking folks through the math of where these sorts of claims come from. Not offering a political commentary on under-policing, or over-inclusive definitions of crime, or whatever else.


