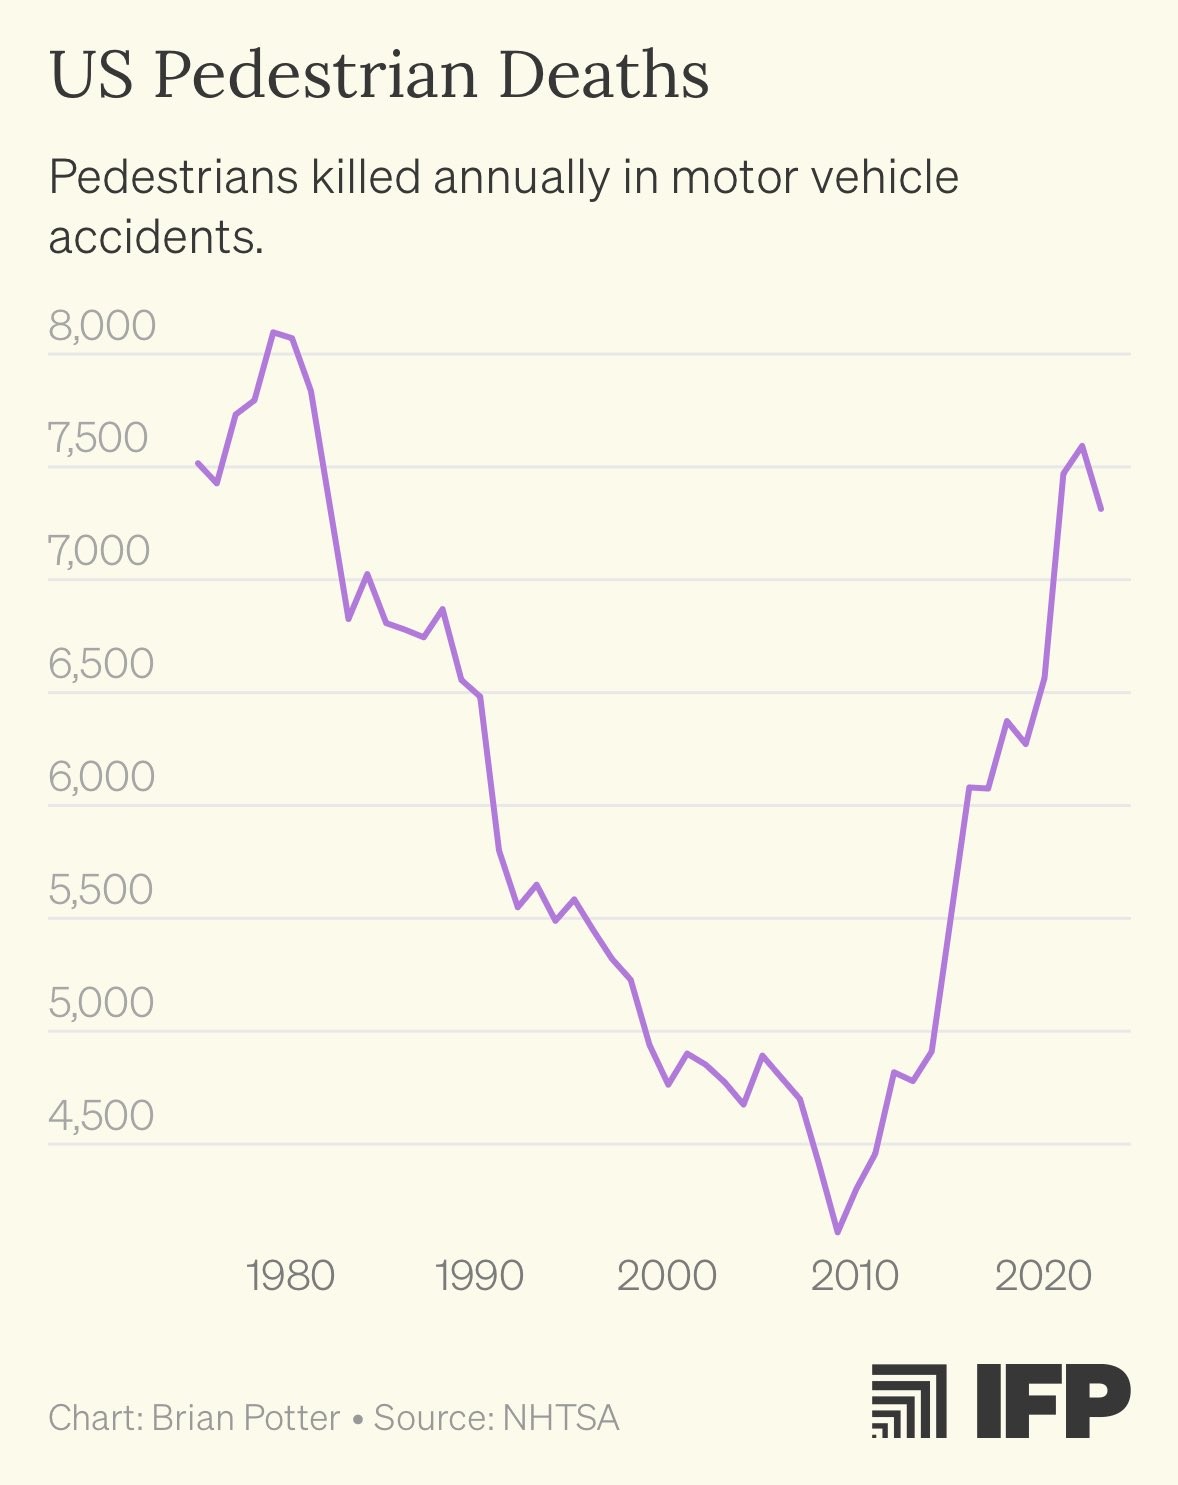
The Picard Maneuver@piefed.world to Just Post@lemmy.worldEnglish · 3 days agoWhat the hell happened around 2010? Smartphones? media.piefed.worldimagemessage-square116fedilinkarrow-up1283arrow-down17
arrow-up1276arrow-down1imageWhat the hell happened around 2010? Smartphones? media.piefed.worldThe Picard Maneuver@piefed.world to Just Post@lemmy.worldEnglish · 3 days agomessage-square116fedilink
minus-squareHadriscus@jlai.lulinkfedilinkarrow-up3arrow-down1·1 day agoIt’s good practice 👍🏼 but I probably go for the trucks explanation here
minus-squareUngraded@lemmy.mllinkfedilinkEnglisharrow-up1·edit-213 hours agoWhy? The curves only correlate after 2010. General increase in car ownership might explain both, more deaths and increased truck sales.


It’s good practice 👍🏼 but I probably go for the trucks explanation here
Why? The curves only correlate after 2010.
General increase in car ownership might explain both, more deaths and increased truck sales.